Measuring Success: Key Performance Metrics to Track Facebook Marketing Campaigns

In the digital marketing industry, Facebook has demonstrated its effectiveness as a potent platform for businesses to engage with their target audience, cultivate brand awareness, facilitate conversions, and generate leads. Nevertheless, merely establishing a presence on Facebook falls short; comprehending how to gauge the effectiveness of your Facebook marketing initiatives is vital for refining your strategies and realizing your objectives. To attain your marketing objectives, you must first overcome the marketing dilemma. Only then can you accurately assess the success of your marketing campaign by using key performance metrics; otherwise, you will confound in solving a single sales issue.
Marketing Dilemma
To run a successful marketing campaign, it is essential to begin by clearly defining your objectives. Nowadays, whenever someone seeks to promote their business or is looking for marketing, a single idea dominates their mind: SALES. They are willing to invest plenty of money in marketing by looking at loads of sales and not understanding the marketing dynamics. They aspire to achieve a 10x increase in sales within the very first month.
Yet, it’s crucial to understand that this is not a realistic expectation. If someone believes that investing a large sum of money will instantly yield significant returns in the form of sales and leads, they are living in a state of illusion.
Brand Awareness
Brand awareness serves as a prerequisite for any success in sales conversion. You can only expect conversions when your brand’s voice is well-recognized, and people are ready to make purchases based on their knowledge of your brand. Without brand awareness, it’s virtually impossible to secure sales in the first month. No brand is born mature and famous; it takes years to establish the trust and awareness among customers that ignite their enthusiasm for a brand. Only then, with the right marketing strategies, can products be effectively sold, resulting in conversions.
Brand awareness surpasses the importance of sales conversion and lead generation
If your brand awareness is strong, you may not even require extensive marketing efforts to drive sales; your product will essentially sell itself.
Hence, for those seeking sales or aspiring to make their marketing campaigns successful, it is imperative to break free from the sales-centric dilemma. Only by doing so will you be able to effectively monitor your marketing campaigns. Let’s consider an example from one of my clients.
Footwear Facebook Marketing Case Study
Return on Ad Spend (ROAS)
In the ever-evolving landscape of digital marketing, Return on Ad Spend (ROAS) has emerged as a pivotal metric for advertisers. ROAS is a straightforward metric that quantifies the financial performance of your advertising campaigns. It calculates the revenue generated from your ads relative to the amount spent on those ads.
It is calculated as ROAS = (Revenue from Ads) / (Ad Spend)
In our case revenue generated from ads is $2.5k (Pkr. 692,209) and the total ad spend was Pkr. 42,102 So, ROAS = 16.4 (692,209/42,102)
0.7M Pkr Sales on Facebook with 16.4 Return on Ad Spend (ROAS)
- Niche: Footwear
- Total Sales: 692,209 (0.7M PKR)
- Ad spent: PKR 42,102
- ROAS: 16.4
- Schedule: 10 Days
- Target Audience: Pakistan
- Objective: Sales
- Destination/CTA: Website
Analyzing Strategy
As you can see from the below statistics, this particular brand has been struggling to achieve sales conversions. Despite its luxurious nature, it has faced challenges in realizing sales targets. The brand has invested a significant amount in marketing campaigns but has fallen short of the aggressive sales objectives it aimed for.
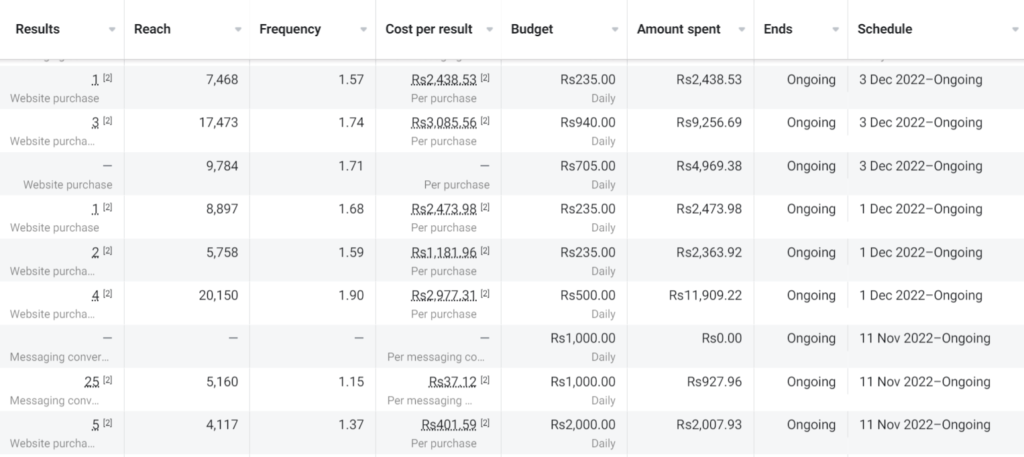
Consequently, we initiated a comprehensive brand transformation, completely overhauling the brand. We launched brand awareness campaigns that yielded positive outcomes. The results demonstrate that the brand has the potential to drive sales. It’s important to note that adhering to the same strategy is not advisable; strategies should be adapted in response to performance results.
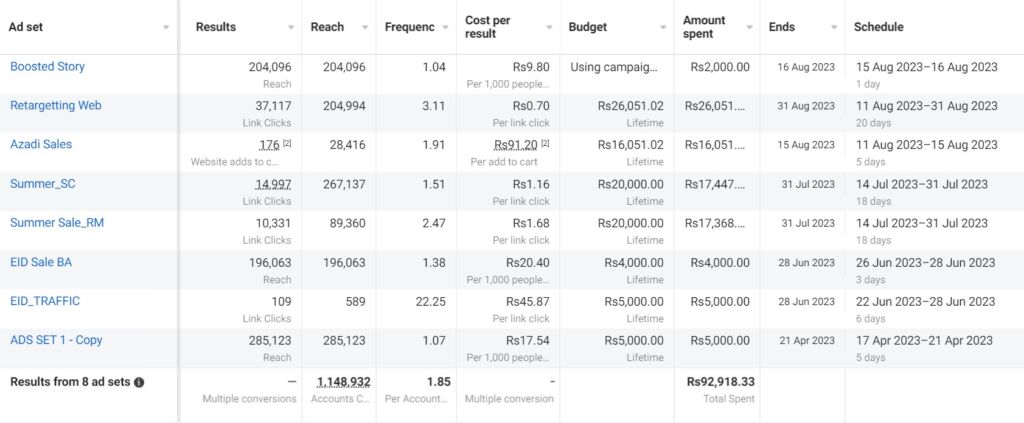
After successfully establishing the brand’s image within its target audience, we achieved sales in our very first campaign, even with a minimal budget. This accomplishment was primarily attributed to our result-driven strategy, What we did was simultaneously run two campaigns.
Running a standalone sales conversion campaign is not as effective unless you accompany it with a retargeting campaign that allows the brand to reach users again and encourage them to make a purchase.

Analyzing Campaign Parameters
- To effectively track any marketing campaign, the initial step is to consider the campaign’s objective. This is because the key performance indicators (KPIs) you use to measure success can vary significantly depending on the specific objectives you aim to achieve. Objectives can include building brand awareness, driving website traffic, fostering engagement, promoting a mobile app, leads generation, and achieving sales conversions.
- Once you’ve identified the campaign’s objective, you can determine the conversion location, which may also serve as the destination. This location could be a website, a mobile app, a lead generation form, or a call or messaging platform.
- The next crucial aspect, which serves as the foundation of your campaign, includes budget and scheduling. Both of these factors are interdependent, and their impact is significant on your target audience.
- A broader audience requires a lower budget to achieve better results. If you have a narrower audience, a high budget will be required. However, here is a thing. If you’re willing to spend less, you can reduce the scheduling. With a reduced schedule, you can derive results effectively even with a lower budget.
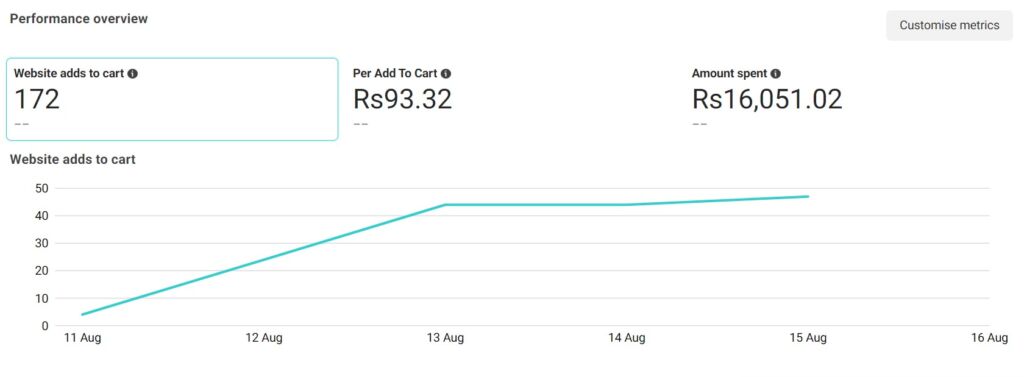
As you can observe from the data, we were able to achieve more sales results with a relatively smaller budget and a minimal schedule. Specifically, we acquired 176 “add to cart” conversions for a cost of 16,051 rupees over the course of five days.
To assess how effectively your budget and schedule are utilized with respect to your target audience, Facebook assigns a relevance score to your advertisements based on their quality and alignment with your audience. This score is rated on a scale of 1 to 10, indicating the extent to which your Facebook ad is resonating with your intended audience. After an ad garners 500 impressions, Facebook generates a relevance score for it, with 10 being the highest possible score.
In the most recent Meta Update, this relevance score has been further segmented into three rankings, providing a more comprehensive evaluation of your ad’s performance. This division allows you to separately track the quality, engagement, and conversion aspects of your ad’s performance. These rankings offer a clear picture of how well your ad is performing, but you can only monitor these metrics when your campaign is active. Once your campaign is paused or completed, these rankings are no longer visible.

However, it’s important to remember that these metrics are not as critical as the results themselves. If leads are constantly being generated, and your bottom line is improving, you need not be overly concerned about these rankings. You don’t have to meticulously monitor every single detail. What truly matters is the positive impact on your business.
Analyzing Campaign Performance
Ultimately, your Facebook marketing efforts and objectives should lead to conversions, whether it’s making a purchase, signing up for a lead generation form, or filling out contact information. It is essential to have Facebook pixels installed for all your campaigns, as they play a crucial role in remarketing & sales conversions, particularly for campaigns focused on conversions.
We can evaluate the performance of these campaigns with the following metrics.
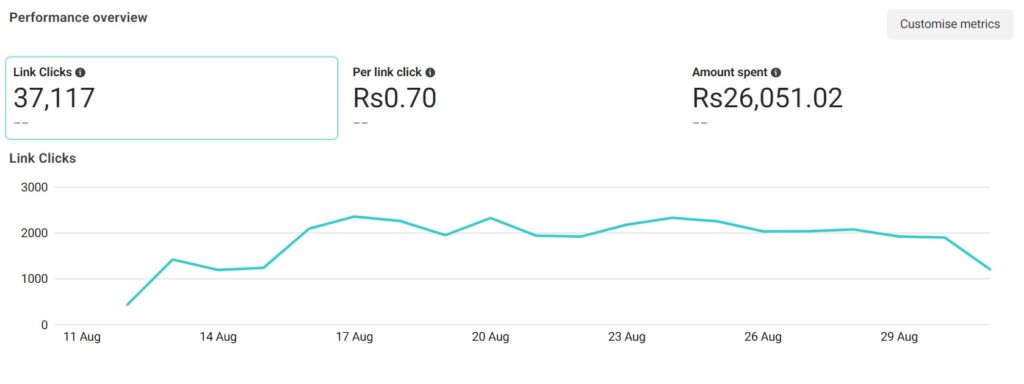
- Ad Clicks: The total number of clicks on your ad.
- Ad Spend: The amount of money spent on your ads.
- Cost Per result: CPC, CPA, CPL or CTR
- Conversion Rate: The percentage of users who completed a desired action after clicking on your ad or post.
- Click-Through Rate (CTR): It indicates how many users clicked on your call-to-action (CTA) links. CTA could be Apply Now, Learn More, sign up, Order Now or Make Purchase
- Cost Per Conversion (CPC): These measures how much you’re spending on advertising for each conversion which could be clicks, sales, leads, purchases & instant form. This also known as Cost Per Click (CPC), Cost Per Lead (CPL), Cost Per Acquisition (CPA)

Analyzing Campaign Results
Now, it’s time to analyze the results of your campaign to determine whether you’ve successfully achieved your desired objectives. You can track conversion results by monitoring the following metrics.
- Added to Cart: It indicates the total number of products that users have added to their shopping carts.
- Payment Information Added: This represents the count of users who have included their payment information during the checkout process.
- Checkout Initiated: It’s the number of users who initiated the checkout process but did not complete the purchase.
- Website Purchases: This signifies the total number of users who have successfully completed purchases on your website.

These metrics provide an evaluation of the cost-effectiveness of your campaigns and make data-driven adjustments to optimize your ROI and ROAS.
Analyze Real-Time Performance
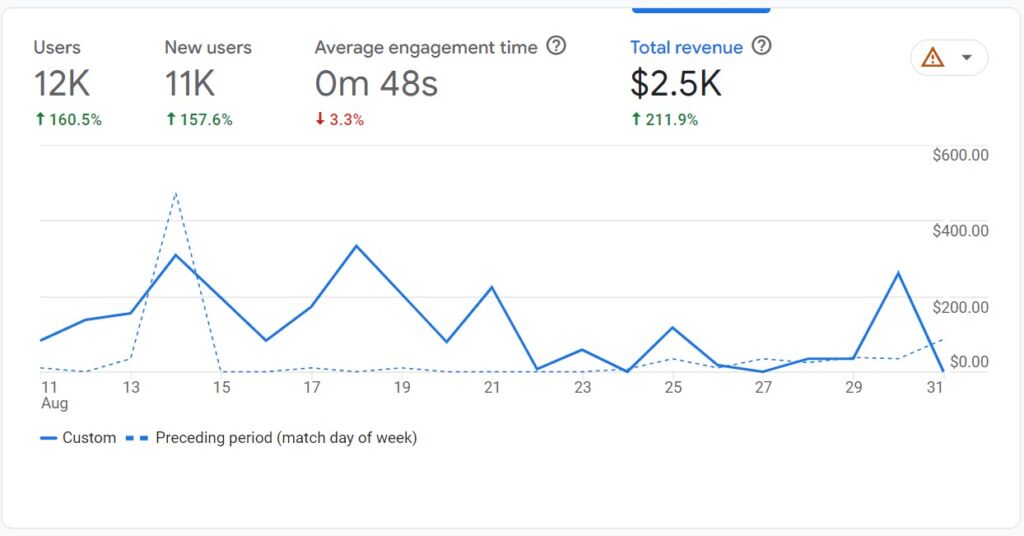
To gain a comprehensive view of your marketing campaign’s performance, it is essential to have integrated Google Analytics with your website and combined it with the Hotjar Heatmap tool. Google Analytics provides valuable insights into your campaign’s performance, such as the number of active website visitors, the proportion of new visitors, and whether the incoming traffic results in conversions or revenue. This integration offers a clear and detailed overview of your campaign’s performance, as illustrated below:
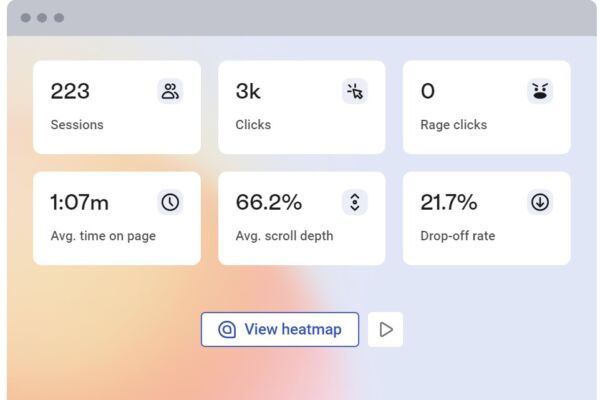
Additionally, by using the Hotjar heatmap tool, you can analyze the behavior of website traffic coming through your marketing campaigns. Hotjar’s analysis can provide insights into user intentions, including their geographic origin, the duration of their website visit, the pages they explored, the products they viewed, and whether they added items to the cart. It also helps identify at which stage users are dropping off and potential reasons for this behavior. Hotjar’s analysis allows you to align your marketing campaign with customer behavior, potentially enhancing your campaign’s performance.
Outcome
Through the refinement of our strategy and diligent monitoring and analysis of the aforementioned metrics, we achieved a notable 0.7 million PKR in sales with an impressive 16.4 ROAS.
The Bottom Line
In the scope of Facebook marketing campaigns, success hinges on the ability to measure various key metrics, spanning from performance management to conversion rates and ROAS. However, it is important to underscore that analyzing the strategy behind these campaigns is of paramount importance. The metrics only provide meaningful insights if your strategy is result-oriented.
Regularly assessing these metrics and employing data-driven adjustments to your strategies ensures that your Facebook marketing endeavors are both productive and efficient. Vigilance regarding these metrics empowers you to fine-tune your approach, connect with your target audience more effectively, and ultimately accomplish your marketing objectives.

